
Device Dashboard
About 2 min
Device Dashboard
Synchronized Device Documentation
This page corresponds to the synchronized Chinese source. Commands, JSON examples, API paths, field names, and screenshots are kept aligned with the Chinese device-side source documentation.
What This Page Covers
- Web console page purpose and related device-side configuration model.
- Available fields, operational workflow, and safety checks.
- Validation steps, logs, and maintenance recommendations.
Source Reference
The detailed operational source is preserved below so implementation details stay exact while the English navigation, titles, and reading path remain available.
设备仪表台
概述: 设备仪表台是 Web 管理界面的首页,提供设备运行状态总览,包括内存使用、WiFi 连接状态、系统运行时间、传感器数据等核心指标。slim 版和 full 版均支持,full 版额外显示日志摘要和用户信息。操作权限:所有角色均可查看。
功能说明
设备仪表台是 FastBee Web 管理界面的首页,提供设备运行状态的实时概览,包括系统信息、网络状态、内存使用、外设状态等关键指标的可视化展示。
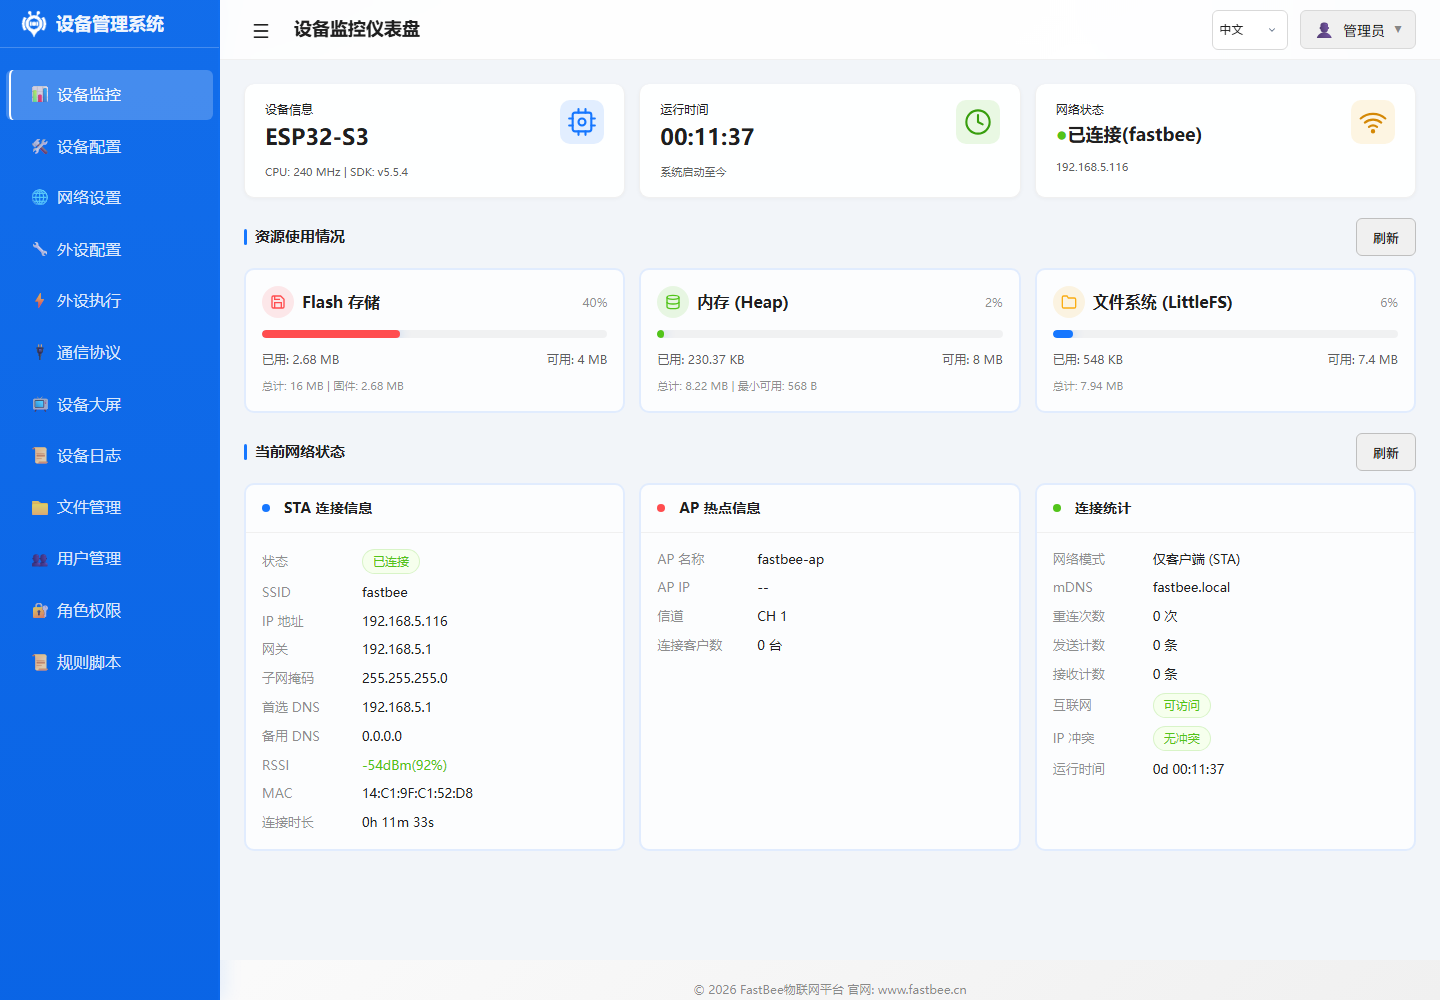
进入系统后建议先看仪表台:网络状态显示当前 IP 和信号强度,资源区域显示堆内存、Flash、PSRAM 等余量,便于判断设备是否已经稳定启动。
操作指南
- 浏览器访问
http://设备IP或http://fastbee.local - 登录后自动进入仪表台页面
- 页面自动定时刷新状态数据
参数说明
系统信息
| 指标 | 说明 |
|---|---|
| 设备名称 | 当前设备配置的名称 |
| 固件版本 | 当前运行的固件版本号 |
| 芯片型号 | ESP32 / ESP32-S3 |
| Flash 大小 | 内部 Flash 存储容量 |
| CPU 频率 | 处理器时钟频率(240MHz) |
运行状态
| 指标 | 说明 |
|---|---|
| 运行时间 | 自上次启动以来的运行时长 |
| 可用内存 | 当前剩余堆内存(字节) |
| 最大空闲块 | 最大可分配连续内存块 |
| WiFi 信号 | 当前 WiFi RSSI 信号强度(dBm) |
| IP 地址 | 当前分配的网络 IP |
| MQTT 状态 | 与服务器的连接状态 |
外设概览
| 指标 | 说明 |
|---|---|
| 已配置外设 | peripherals.json 中配置的外设总数 |
| 已启用外设 | enabled=true 的外设数量 |
| 执行规则数 | periph_exec.json 中的规则总数 |
| 活跃规则数 | enabled=true 的规则数量 |
配置示例
仪表台为只读展示页面,无需额外配置。数据自动从系统内部采集。
故障排除
| 问题 | 可能原因 | 解决方案 |
|---|---|---|
| 页面无法访问 | WiFi 未连接 | 检查网络配置或使用 AP 模式连接 |
| 数据不更新 | WebSocket 断开 | 刷新页面重新连接 |
| 内存持续下降 | 内存泄漏 | 检查外设配置,减少启用数量 |
| MQTT 离线 | 服务器不可达 | 检查 MQTT 配置和网络连通性 |